NMR Cholesterol Blood Test Results: I’m still alive (what a relief!)
Several months ago I got a letter from my health insurance company telling me that they thought I should start taking statins.
Number A) That’s crazy!
Number B) No freaking way am I taking statins, given what I know about their side effects.
Number C) Are we looking at the same results? Because the ones I’m looking at are awesome.
It was time for me to go to my doctor and I had decided it was time to get either a VAP or an NMR Lipid Profile done. Why? LipoProtein particle count is important. Far more important than the density of the lipids within the protein so far as being an indicator of likely cardiovascular disease (CVD).
So I went to my doctor a few weeks ago, told him about the letter and told him I wanted to do an NMR or VAP. His initial response was “how on earth do you know what those are?” Next he pulled up my previous results and was rather confused since according to him my numbers were fine “are you sure they got the right person?” Anyway, he asked which one I wanted (NMR or VAP) – I wasn’t picky so I just said “Whichever one is more expensive.” I figure if they’re saying crazy stuff about me taking statins, they need to pay for it. So I got an NMR, the results took about 2 weeks to come back. Turns out that 2 years of a ketogenic diet is treating me just fine. So, let’s compare my “regular” lipid panel numbers!
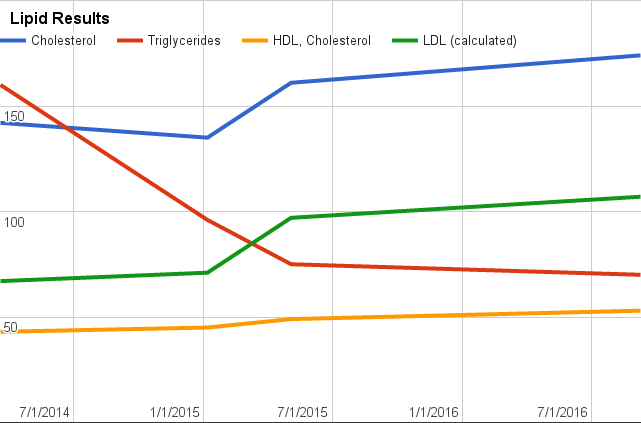
March 2014 was 3 months after I started People Chow (high carb). January 2015 I was 3 months into keto. May 2015 I was 7 months into keto. September 2016 and I’m very close to 2 years of keto. I’m at less than half my previous triglyceride number, HDL continues to climb. Total Cholesterol and LDL are up as well but that’s why I wanted the NMR.
| 3/20/2014 | 1/6/2015 | 5/4/2015 | 9/8/2016 | target | |
| Cholesterol | 142 | 135 | 161 | 174 | 0-200 mg/dL |
| Triglycerides | 160 | 96 | 75 | 70 | 0-200 mg/dL |
| HDL Cholesterol | 43 | 45 | 49 | 53 | 40-60 mg/dL |
| LDL (calculated) | 67 | 71 | 97 | 107 | 0-160 mg/dL |
OK, now for the NMR numbers:
| Test | value | target |
| LDL Particle Number by NMR | 943 | <1000 |
| LDL Cholesterol | 107 | < 100 |
| HDL Cholesterol | 53 | >39 |
| HDL Particle Number | 32.3 | >=30.5 |
| Small LDL Particle Number | 212 | <=527 |
| LDL Particle Size | 20.7 | >20.5 |
| Large VLDL Particle Number | 1 | <=2.7 |
| Small LDL (Particle Number) | 212 | <=527 |
| Large HDL Particle Number | 3.3 | >=4.8 |
| VLDL Size | 43.1 | <=46.6 |
| LDL Size | 20.7 | >=20.8 |
| HDL Size | 8.6 | >=9.2 |
| LP Insulin Resistance Score | 46 | <=45 |
Conclusion from my doctor? “Great on LDL number. Size is good. HDL is good, particle number is a little low but not alarming alone. Overall, I would NOT take a statin at this time. Insulin resistance is slightly elevated.” He’s talking about that last number. It’s a score LabCorp assigns based on a couple factors as explained in their test detail document:
Metabolic Syndrome Markers. Three parameters (average LDL size and pattern, large HDL particle number, and large VLDL particle number ) are reported that are closely associated with insulin resistance and increased risk of developing type 2 diabetes mellitus.
Well yeah, Back 2 years ago I decidedly had metabolic syndrome and was well along the path of developing “type 2 diabetes mellitus” as they say. Not any more =)
On a final note, I used the numbers I got from this test to complete a “Healthy Living Assesment” for my health insurance (hey, $70 is $70!) the computer recommends I eat less fat to be more healthy. –SIGH–

Chris Bair created Keto Chow to simplify getting good nutrition for "I just need food" meals, focusing on the best available proteins, vitamins, and minerals to save mental energy for important things. You don't have to be doing keto to use Keto Chow but it does make keto easier. In 2023 Chris created SALTT Electrolytes ('salty') as an alternative to existing electrolytes that contained questionable ingredients, like maltodextrin, and didn't align with what he wanted in an electrolyte supplement. The number 1 best seller is the unflavored Clean Slate.